
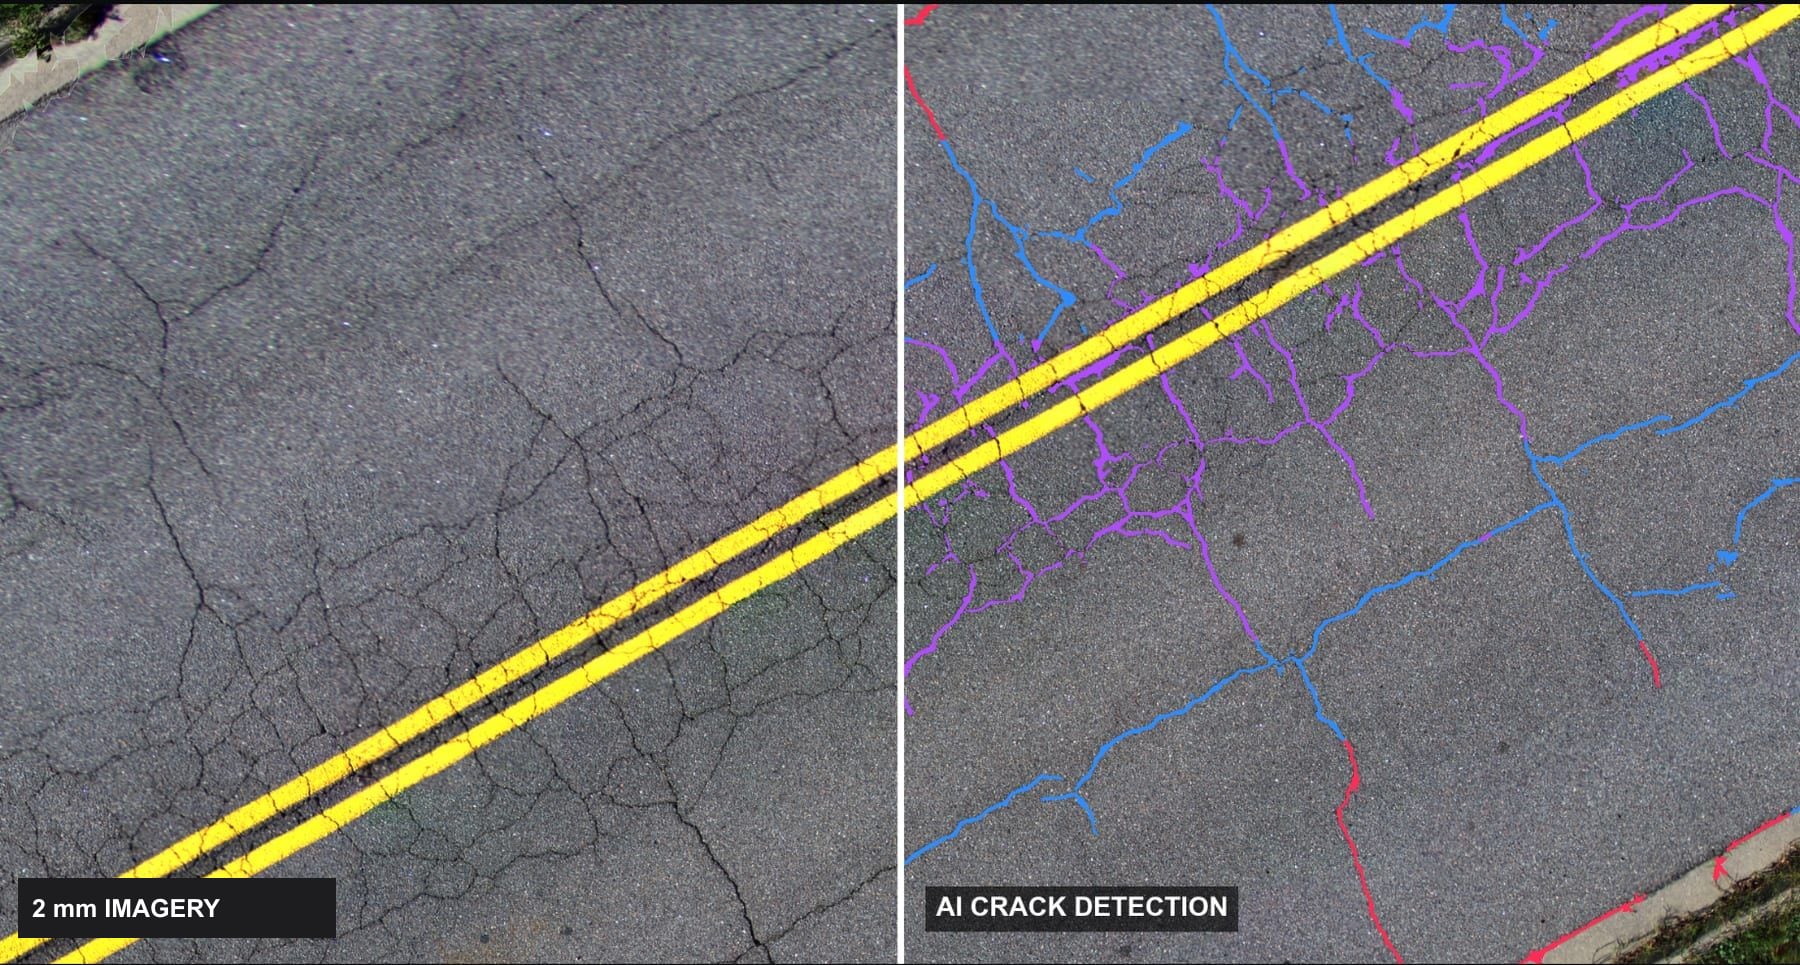
One drive. Every crack, measured.
In October 2026 we surveyed a two-lane asphalt road in South Carolina with PIVAI Atlas to show what a single drive-through can deliver.
Survey-grade, with no lane closures.
Atlas was mounted on an ordinary vehicle and driven at 20 mph in normal traffic. Three rear-facing industrial cameras, fanned to overlap across the lane, recorded the pavement while a GNSS/INS logged position and orientation for every frame.
The images were combined into one seamless 2 mm image of the road and a 5 mm elevation model. PIVAI's AI then found every visible crack, measured it and classified it.
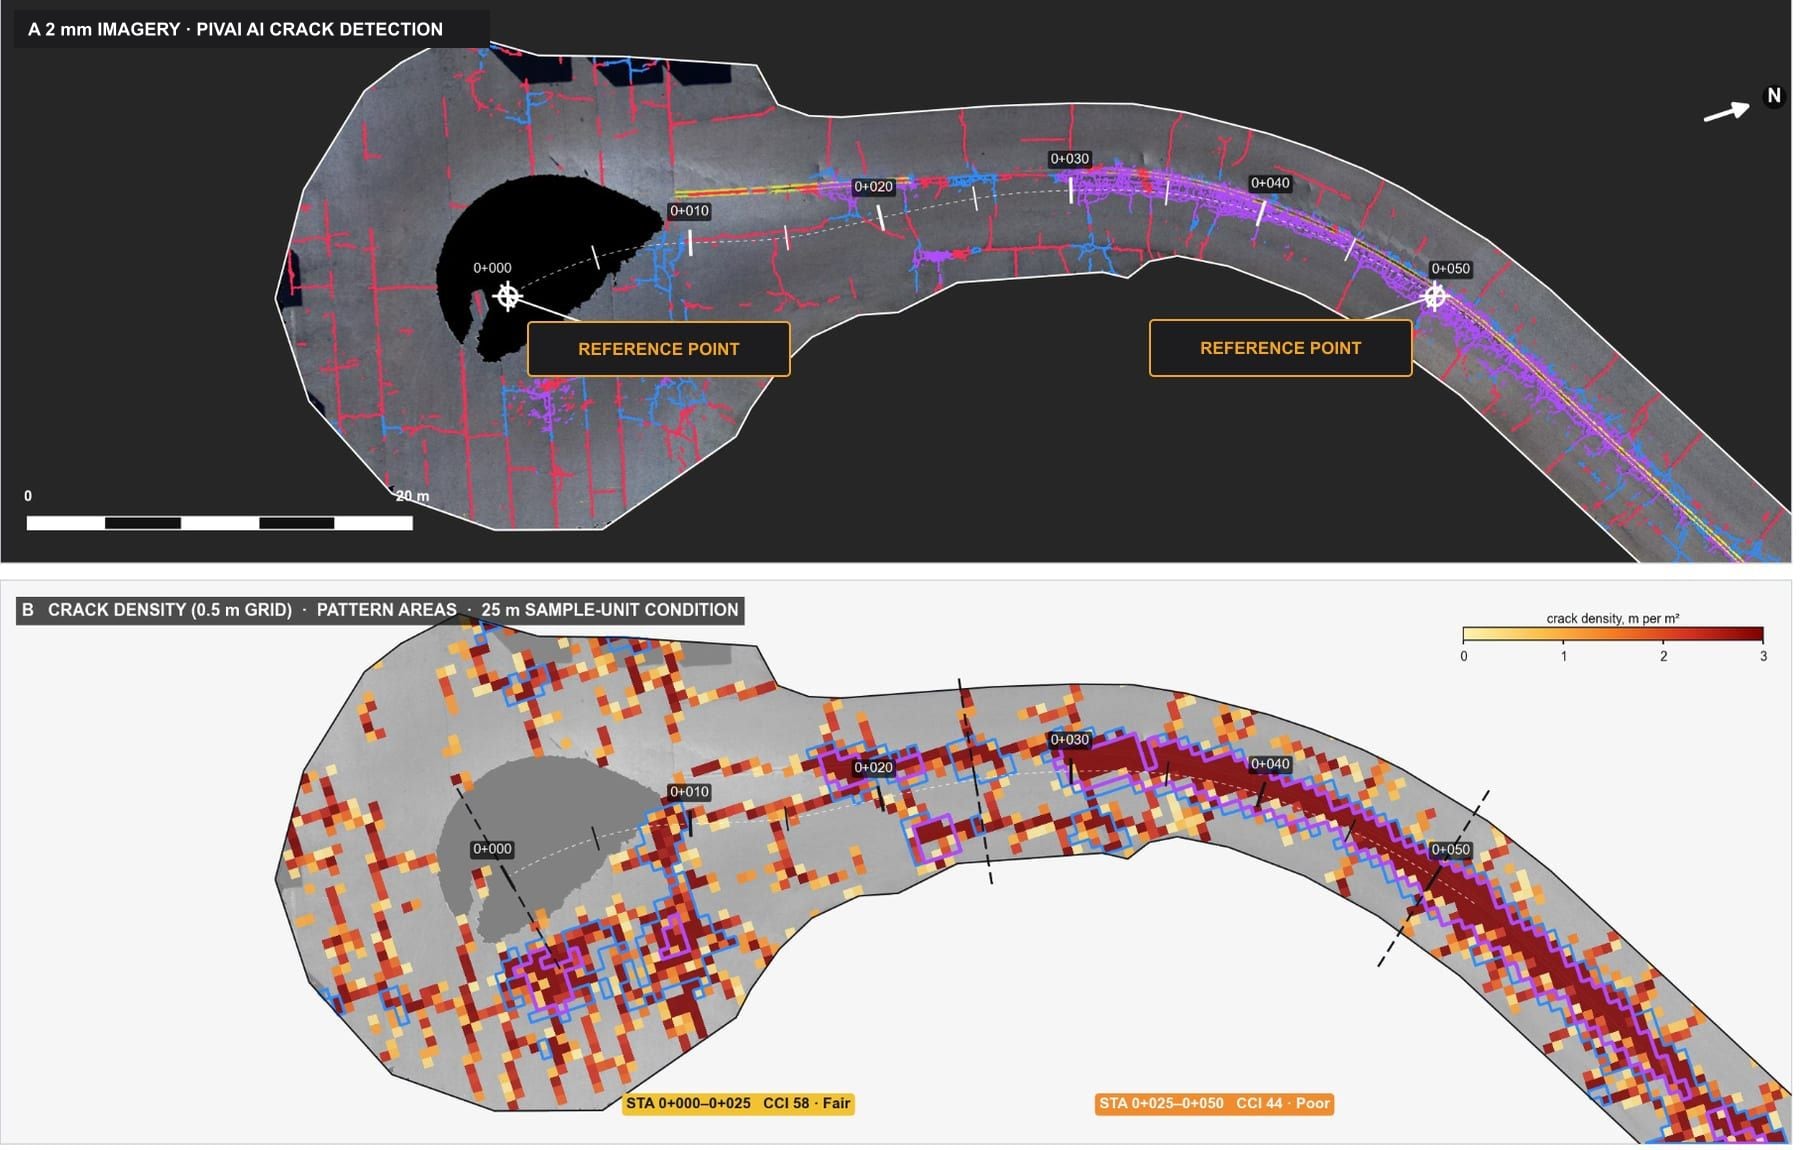
Not just where it's cracked: how, and how badly.
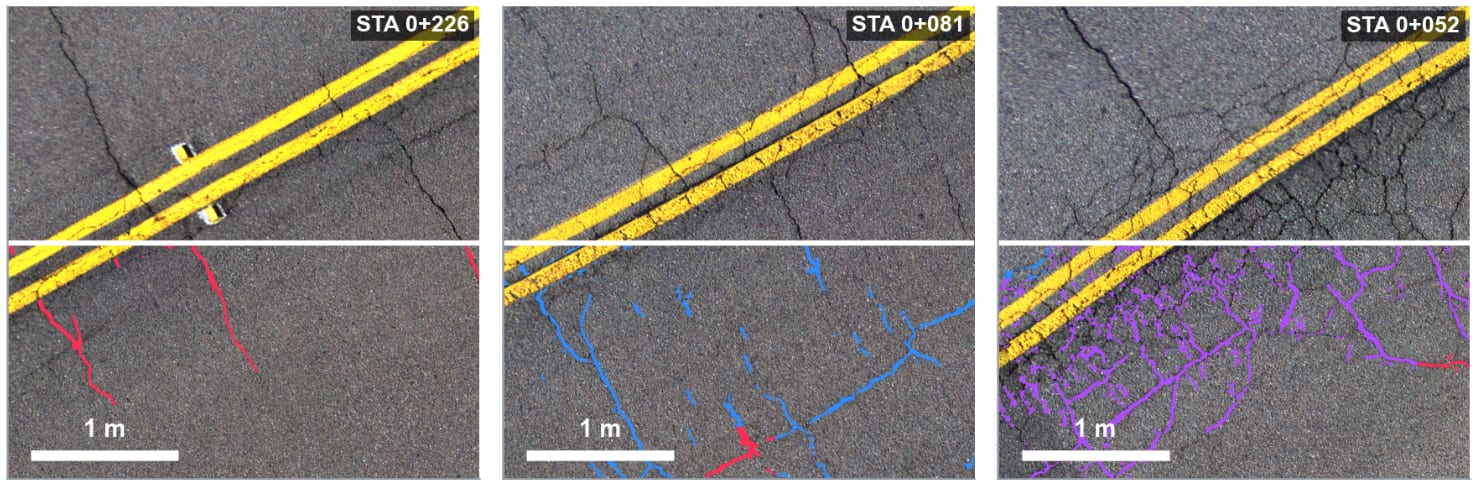
Each crack is classified by the pattern it forms with its neighbours, following the distress definitions in ASTM D6433.
Fair overall, with clear hot spots
Of 33 sample units (25 m each): 3 Good, 10 Satisfactory, 4 Fair, 14 Poor and 2 Very Poor. The worst 250 m stretch accounts for most of the block and alligator cracking.
The joint, not the wheel path
Cracking peaks within about 1 m of the centre line, pointing to the centre-line construction joint as the main source of deterioration rather than traffic fatigue.
Mostly early-stage cracking
69% of crack length is narrower than 10 mm (low severity), and transverse cracks dominate (44%): the profile of ageing asphalt that is still in the preservation window.
Quantities that go straight into an estimate.
Because every crack is measured, the survey produces scoping quantities directly, not just a score.
- Crack sealing1,050 m of isolated cracks ≥ 10 mm
- Crack filling2,052 m of isolated cracks < 10 mm
- Joint sealing814 m of centre-line joint, full length
- Block cracking1,294 m² (18.9% of the asphalt)
- Alligator cracking370 m² (5.4% of the asphalt)
- RehabilitationOne candidate section of 1,960 m²
What the client receives.
Everything shares one coordinate reference, so imagery, crack maps and tables overlay exactly in any GIS or CAD package.
Condition report
Summary, ratings, worst sections, maintenance quantities, method and limitations.
Map book, 11 × 17 in
Every detected crack drawn on the 2 mm imagery, with statistics for each sheet.
GIS & CAD data
2 mm imagery and 5 mm elevation GeoTIFFs, classified crack map, GeoJSON and CSV.
Google Earth package
Imagery, cracks and road sections coloured by condition in a single KMZ.
Argus video
Roadside asset detection video recorded with PIVAI Argus on nearby roads.
Next steps
Network-wide surveys, repeat surveys for change detection, and data for pavement management systems.
Indicative results from a demonstration survey. The crack condition index is a crack-based proxy for PCI following ASTM D6433 methods in simplified form.
Want this for your roads?
We run demonstration surveys for agencies, airports and consultants. Tell us about your network.