From the road to the work order.
Hardware captures the road. The PIVAI platform turns it into decisions: capture, AI detection, human review, a living map of your network and the reports and GIS files your team already uses.
Watch the AI work while you drive.
Argus Live shows the camera feed with every detection as it happens, live counts by class and a route map, so operators know the survey is complete before they get back to the yard.
 Argus Live · Route 14 · Northbound
Session
- Survey
- Network A · Day 3
- Vehicle
- Unit 02
- Operator
- J. Rivera
- Distance
- 18.6 mi
Controls
Sensors
Live detections
Route
Real-time detections
Signs, lights, poles, markings, cracks and potholes boxed and counted at 30 FPS.
Sensor health at a glance
Camera, depth, GNSS, edge AI and upload status in one panel.
Mark events
One tap to flag a hazard or take a snapshot for follow-up.
Survey-grade capture you can trust in the field.
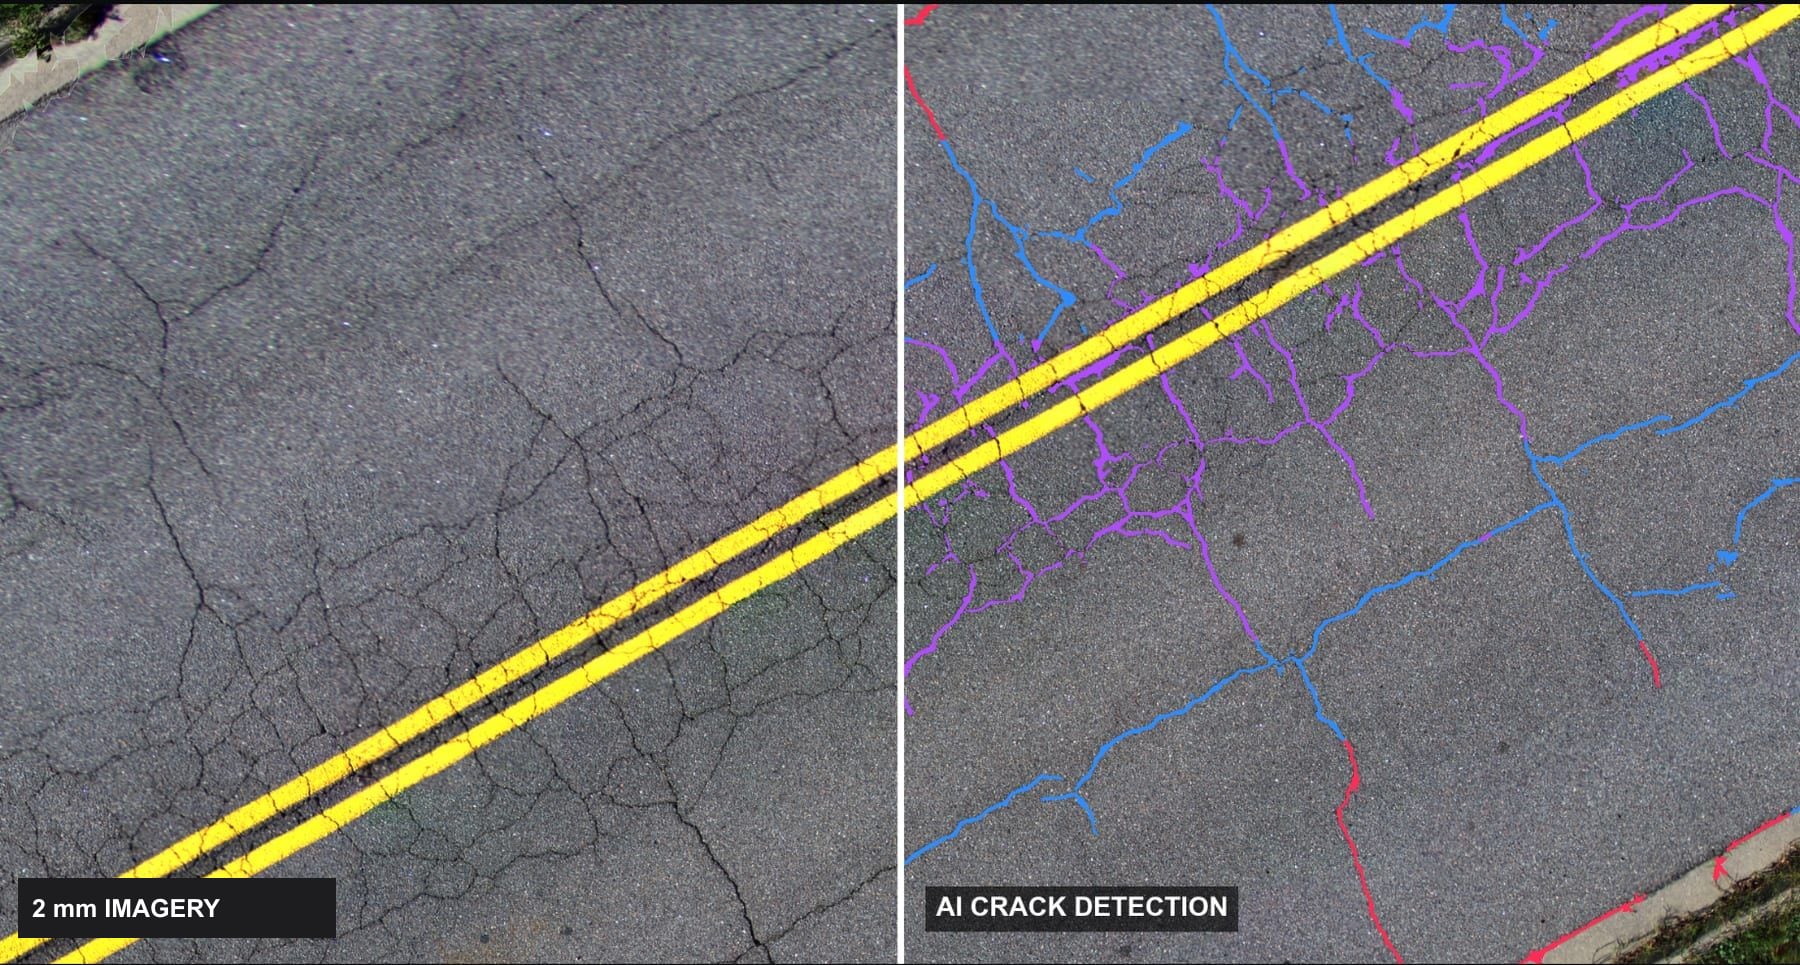
Atlas Capture monitors all three cameras, lane coverage and positioning quality, so every square metre is imaged at 2 mm with no gaps and no re-runs.
Atlas Capture · Precision pavement surveySurvey speed
Positioning · GNSS / INS
- Solution
- RTK fixed
- Satellites
- 21
- Position σ
- 0.018 m
- Heading σ
- 0.05°
- Time sync
- PPS locked
Controls
Coverage, not guesswork
Live footprint overlap across the full lane, with gap warnings.
Positioning quality
GNSS/INS solution, satellites and accuracy for every frame.
Speed guidance
Stay in the target speed band while driving with traffic.
Every AI finding, checked in seconds.
Engineers stay in control. Review sorts detections by confidence, lets you measure and correct them, and keeps an audit trail of every decision.
PIVAI Review · QA queue · Network AQueue · sorted by confidence
Attributes
Severity (ASTM D6433)
- Area
- 0.42 m²
- Mean width
- 7.7 mm
- Max depth
- 14 mm
- Confidence
- 0.91
- Position
- Lane 1 · right wheel path
Decision
Confidence-sorted queue
High-confidence detections are auto-accepted; your time goes to the uncertain ones.
Measure and correct
Width, area and depth tools on 2 mm imagery and the 3-D surface.
Keyboard-fast
Accept, edit or reject with one key and move on.
Your whole network, coloured by condition.
PIVAI Map puts every segment, crack, pothole and asset on one map. Click any road to see its condition index, imagery and recommended treatment.
PIVAI Map · Network conditionLayers
Filter by rating
Network
- Segments
- 1,712
- Mean CCI
- 64 · Fair
- Poor or worse
- 23%
- Potholes
- 137
- Crack density
- 1.9 m/m²
- Alligator area
- 18%
- Potholes
- 4
- Last survey
- Oct 2026
Selected segment
Condition along segment
Recommended action
- Treatment
- Mill & overlay
- Area
- 1,180 m²
- Priority
- High
Condition at a glance
Segments coloured by condition index, from good to failed.
Down to the crack
Zoom from the network to 2 mm imagery of a single crack.
Share a link
Send a live map to a manager, a contractor or a council.
Reports engineers and GIS teams already understand.
PIVAI Reports produces the condition report, map book and the GIS and CAD files your pavement management system needs, ready for maintenance planning.
PIVAI Reports · Survey summary · Network A- Crack sealing ≥ 10 mm
- 3,920 m
- Crack filling < 10 mm
- 7,640 m
- Joint sealing
- 5,210 m
- Patching (alligator areas)
- 1,180 m²
- Rehabilitation candidates
- 9 segments
- Pothole repairs
- 137
Deliverables
Send to
Standards-based
Crack classification and condition index following ASTM D6433 methods.
Maintenance quantities
Crack sealing, patching and rehabilitation areas ready for scoping.
Open formats
PDF, GeoTIFF, GeoJSON, CSV and KMZ for ArcGIS, QGIS, PAVER and CAD.
Interfaces shown are previews of the PIVAI platform.
See the platform on your own data.
We'll survey a sample of your network and walk you through the results in the platform.